
Retail Performance Metrics: 25 KPIs
Every Manager Should Track
Retail Performance Metrics: 25 KPIs Every Manager Should Track

Here are the retail performance metrics every store manager and analyst should track, grouped by Money, Efficiency, People, and Results.
TL;DR — Start here:
Money (profitability)
- Gross Margin % = (Revenue − COGS) ÷ Revenue × 100
- Net Profit Margin % = Net Profit ÷ Revenue × 100
- Same-Store Sales Growth = (Current Period Sales − Prior Period Sales) ÷ Prior Period Sales × 100
Efficiency (inventory & space)
- Inventory Turnover = COGS ÷ Average Inventory
- Sell-Through Rate = Units Sold ÷ Units Received × 100
- GMROI = Gross Profit Dollars ÷ Average Inventory Cost
- Sales per Square Foot = Net Sales ÷ Total Selling Area (sq ft)
- In-Stock % = SKUs In Stock ÷ Total SKUs × 100
People (traffic & labor)
- Foot Traffic = total visitor count (people counter or Wi-Fi beacon)
- Conversion Rate = Transactions ÷ Visitors × 100
- Sales per Employee = Net Sales ÷ Number of Employees
- Labor Cost % = Total Labor Cost ÷ Net Sales × 100
Results (customer & transaction)
- Average Transaction Value (ATV) = Net Sales ÷ Number of Transactions
- Basket Size (Units per Transaction) = Units Sold ÷ Number of Transactions
- Customer Retention Rate = ((End Customers − New Customers) ÷ Start Customers) × 100
- Shrinkage Rate = (Recorded Inventory − Physical Count) ÷ Total Sales × 100
Single-store managers: start with Conversion Rate, ATV, and Gross Margin — three numbers that immediately reveal whether your floor is converting visitors and whether those sales are profitable. Multi-store operators: layer in Same-Store Sales Growth, Sales per Square Foot, and Labor Cost % to compare locations on a level playing field.
Table of Contents
- How retail KPIs group into four categories you can actually use
- 1. Sales and revenue metrics — formulas, benchmarks, and how to improve them
- 2. Customer and traffic metrics — footfall, conversion, and retention
- 3. Inventory and product metrics — turnover, sell-through, GMROI, and more
- 4. Operational and people metrics — labor productivity and shift-level examples
- 5. Profitability and margin metrics — gross profit, net profit, and COGS
- 6. How to choose the right KPIs and set targets for your store
- 7. Why unified data and real-time dashboards make KPIs worth tracking
- 8. Common mistakes and red flags when using retail KPIs
- Key Takeaways
- Why these metrics matter more than the tools you use to track them
- Datalakehouse makes your KPI data work in real time
- Useful sources and further reading
How retail KPIs group into four categories you can actually use
Retail metrics fall into four functional groups, and tracking all four together is what separates a useful dashboard from a data dump.
- Money answers: "Are we profitable?" Gross margin, net profit, and year-over-year sales growth live here.
- Efficiency answers: "Are we using our assets well?" Inventory turnover, GMROI, sell-through, and sales per square foot measure how hard your space and stock are working.
- People answers: "Are visitors converting, and is our team productive?" Foot traffic, conversion rate, sales per employee, and labor cost % belong here.
- Results answers: "What is each customer worth?" ATV, basket size, retention rate, and customer lifetime value (CLV) capture transaction-level and relationship-level outcomes.
The real power comes from pairing metrics across groups. Foot traffic (People) combined with conversion rate (Results) tells you whether a sales dip is a demand problem or a floor-execution problem. GMROI (Efficiency) paired with gross margin (Money) shows whether a high-margin category is actually earning its shelf space. No single KPI provides a complete picture on its own.
Dashboard layout guidance: Review Money and Efficiency metrics weekly; review People metrics daily during trading hours; review Results metrics monthly alongside CLV and retention trends. This tiered cadence, recommended by NetSuite's retail KPI framework, keeps operational decisions timely without burying managers in noise.
Pro Tip: Build your dashboard in three layers: a daily operational view (traffic, conversion, daily sales), a weekly performance view (ATV, labor cost %, sell-through), and a monthly strategic view (gross margin, CLV, same-store sales growth). Mixing all three on one screen creates alert fatigue.

1. Sales and revenue metrics — formulas, benchmarks, and how to improve them

Sales metrics are the most visible examples of retail performance metrics, but they are also the most easily misread without context.
Sales per square foot
Definition: How much revenue each square foot of selling floor generates annually. Formula: Net Sales ÷ Total Selling Area (sq ft)
The U.S. national retail average sales per square foot varies depending on category and location. Viable brick-and-mortar retail typically needs strong sales per square foot to cover occupancy costs. Retailers like Walmart and Costco generally achieve higher sales per square foot relative to other stores, with Costco performing strongly.
Why it matters: A store generating $200/sq ft is either over-spaced or under-selling. Use it to justify lease renegotiations or floor resets.
How to improve:
- Relocate slow-moving categories to lower-traffic zones; move high-margin impulse items near the register.
- Reduce dead floor space with pop-up fixtures or seasonal displays.
- Track by department, not just total store, to find the underperforming zones.
Average transaction value (ATV)
Definition: The average dollar amount a customer spends per visit. Formula: Net Sales ÷ Number of Transactions
Average transaction value varies widely by category, with typical North American retail values differing by product type. Increasing ATV by 10% delivers the same revenue lift as a 10% traffic increase, typically at a fraction of the cost.
How to improve:
- Train staff on add-on and complementary product suggestions.
- Bundle related SKUs at a slight discount to raise basket value.
- Set minimum thresholds for free shipping or a gift-with-purchase offer.
Same-store sales growth (comparable-store sales)
Definition: Revenue growth at stores open for at least 12 months, stripping out the effect of new openings. Formula: (Current Period Sales − Prior Period Sales) ÷ Prior Period Sales × 100
This is the chain-level metric that investors and operators use to judge organic performance. A positive same-store number means existing locations are growing; a negative number signals a real problem even if total revenue is up due to new stores.
How to improve:
- Identify the bottom quartile of stores by same-store trend and run a root-cause analysis (traffic, conversion, or ATV?).
- Align promotional calendars to the periods where same-store comps are weakest.
Basket size (units per transaction)
Definition: The average number of items in each transaction. Formula: Units Sold ÷ Number of Transactions
Basket size and ATV move together but can diverge: a rising ATV with a flat basket size means customers are buying fewer, pricier items. That is useful intelligence for assortment planning.
Pro Tip: Track basket size by day of week and time of day. Weekend baskets are often larger because shoppers are less rushed. If weekday baskets are thin, a targeted midweek promotion or a "complete the look" display can close the gap.
| Metric | Formula | U.S. Benchmark |
|---|---|---|
| Sales per sq ft | Net Sales ÷ Selling Area | — |
| ATV | Net Sales ÷ Transactions | — |
| Same-store sales growth | (Current − Prior) ÷ Prior × 100 | Positive = healthy; negative = flag |
| Basket size | Units Sold ÷ Transactions | Varies by category |
2. Customer and traffic metrics — footfall, conversion, and retention
Traffic metrics are leading indicators. They tell you what is coming before it shows up in your revenue line.
Foot traffic
Definition: The total number of visitors entering a store during a defined period. Measurement methods:
- Infrared or video-based people counters mounted at entrances (highest accuracy)
- Wi-Fi or Bluetooth beacon tracking (useful for zone-level dwell time)
- POS transaction counts as a rough proxy (undercounts because not every visitor buys)
Foot traffic by day of week and time of day reveals staffing and merchandising opportunities. A spike from a promotion that does not lift conversion means the offer attracted the wrong audience or the floor experience failed to close.
Conversion rate
Definition: The percentage of store visitors who complete a purchase. Formula: Transactions ÷ Visitors × 100
Benchmarks by store type:
- General retail: 20–40%
- High-traffic mall stores: 15–20%
- Specialty/destination stores: 40–60%
- Convenience stores: 80–95%
Accurate conversion depends on synchronized footfall and POS data. Misaligned timestamps between people-counting hardware and POS systems produce erroneous rates — a common data-quality trap covered in the pitfalls section below.
How to improve:
- Greet customers within 30 seconds of entry; studies consistently show engagement reduces walk-outs.
- Identify the highest-traffic hours with the lowest conversion and schedule your best closers there.
- Review product placement at the entrance: the first 10 feet of floor space sets the purchase intent.
Capture rate
Definition: The percentage of people passing the store who actually enter. Formula: Store Entrants ÷ Passersby × 100
Capture rate is especially useful in mall and high-street locations. A low capture rate points to a window display, signage, or exterior presentation problem rather than an in-store issue.
Customer retention rate
Definition: The share of customers who return within a defined period. Formula: ((Customers at End of Period − New Customers) ÷ Customers at Start of Period) × 100
Acquiring a new customer costs more than keeping an existing one. Retention rate is the clearest signal of whether your loyalty program, post-purchase communication, and product quality are working together.
How to improve:
- Segment returning customers by recency and frequency; target lapsed buyers with a win-back offer before they go cold.
- Use loyalty program data to identify the purchase interval for your best customers and time re-engagement campaigns just before that interval expires.
- Track retention by acquisition channel to find which source brings the most loyal buyers, not just the most buyers.
Repeat purchase rate
Definition: The percentage of customers who make more than one purchase in a period. Formula: Customers with 2+ Purchases ÷ Total Customers × 100
This is a tighter version of retention that focuses on transaction behavior rather than customer presence. A high repeat purchase rate with a low ATV often means customers love the store but are only buying small items — a cross-sell opportunity.
3. Inventory and product metrics — turnover, sell-through, GMROI, and more
Inventory KPIs directly affect cash flow, product availability, and margin. Getting them right is the difference between a lean, profitable assortment and a warehouse full of markdowns.
1. Inventory turnover ratio
Definition: How many times your full inventory sells and is replaced within a year. Formula: COGS ÷ Average Inventory
Benchmarks by category:
| Category | Typical Turns |
|---|---|
| Grocery / perishables | 15–20x+ |
| Fashion / apparel | 6–12x |
| General merchandise | 4–8x |
| Home furnishings | 2.5–5x |
Low turnover ties up cash; excessively high turnover risks stockouts. Use turnover at the category level, not just store-wide, to find the slow-moving pockets.
2. Sell-through rate
Definition: The percentage of received inventory that sold during a period. Formula: Units Sold ÷ Units Received × 100
- Healthy range for most retailers: 70–80%
- Strong performance: 80%+
- Warning sign: below 50%
- Fashion entering markdown season: target 60–70%
Sell-through is especially critical for seasonal and trend-driven categories where unsold inventory loses value quickly. Review it weekly during peak season, not monthly.
3. In-stock percentage
Definition: The share of SKUs that are available for sale at any given time. Formula: SKUs In Stock ÷ Total Active SKUs × 100
A low in-stock percentage directly costs sales and damages customer trust. Track it at the SKU level, not just the category level, to catch the specific items causing stockouts.
4. Stockout rate
Definition: The percentage of time a SKU is unavailable when a customer wants it.
Stockout rate is the inverse of in-stock percentage and is most useful for high-velocity SKUs where a single day out of stock can mean hundreds of lost transactions.
Improvement tactics for inventory metrics:
- Set reorder points based on lead time plus safety stock, not just historical averages.
- Run ABC analysis monthly: A-items (top 20% of revenue) need tighter reorder triggers than C-items.
- Use sell-through data mid-season to decide on early markdowns vs. holding price.
- For perishables, align order quantities to day-of-week traffic patterns.
5. GMROI (gross margin return on investment)
Definition: How many dollars of gross profit you generate for every dollar invested in inventory. Formula: Gross Profit Dollars ÷ Average Inventory Cost
A GMROI above 1.0 means you are at least recovering your inventory investment. Most retailers target 2.0 or higher. A GMROI of 2.5 means you are generating $2.50 in gross profit for every $1.00 in inventory cost. A product with a high gross margin but slow turnover can still produce a poor GMROI — that is the insight the metric is designed to surface.
4. Operational and people metrics — labor productivity and shift-level examples
Labor is typically the second-largest cost in retail after occupancy. These metrics connect staffing decisions to revenue outcomes.
Sales per employee
Definition: Revenue generated per employee during a period. Formula: Net Sales ÷ Number of Employees (or FTE count)
Calculate this at the shift level, not just monthly, to identify high-performing shifts and replicate their conditions. A Saturday afternoon shift with two experienced associates might generate 40% more sales per employee than a Monday morning with the same headcount.
Labor cost as a percentage of sales
Definition: What share of revenue goes to labor. Formula: Total Labor Cost ÷ Net Sales × 100
Most specialty retailers target labor cost at 15–20% of sales; grocery and high-volume discount formats run tighter at 8–12%. When labor cost % rises without a corresponding rise in conversion or ATV, it is a scheduling efficiency problem.
How to improve:
- Match shift scheduling to hourly traffic data, not fixed weekly templates.
- Cross-train staff to cover multiple departments, reducing the need for overstaffing in slow zones.
- Set a labor cost % target by day type (weekday vs. weekend) rather than a single weekly average.
Transactions per labor-hour
Definition: The number of completed sales transactions per hour of labor worked. Formula: Total Transactions ÷ Total Labor Hours
This metric is useful for comparing checkout efficiency across locations. A store with the same transaction volume but more labor hours is either overstaffed or has a process bottleneck at the register.
Units per transaction (UPT)
Definition: The average number of units sold per transaction. Formula: Units Sold ÷ Number of Transactions
UPT is a direct measure of cross-selling effectiveness. A UPT of 1.2 means most customers are buying a single item; a UPT of 2.5 means staff are successfully adding to baskets. Track it by associate to identify coaching opportunities.
Improvement tactics:
- Introduce cross-selling scripts tied to the top 20 product combinations in your POS data.
- Set UPT targets by department and review them in weekly team huddles.
- Reward associates who consistently hit UPT targets with recognition or incentive pay.
5. Profitability and margin metrics — gross profit, net profit, and COGS
Margin metrics are where the business model either holds up or falls apart.
Gross profit and gross margin %
Definition: Gross profit is revenue minus the cost of goods sold. Gross margin % expresses that as a share of revenue. Formula: (Revenue − COGS) ÷ Revenue × 100
Gross margin benchmarks by category (NYU Stern, January 2024):
| Category | Average Gross Margin |
|---|---|
| Apparel / fashion | 20–40% |
| Home furnishings | 15–20% |
| General merchandise | ~30% |
| Consumer electronics | 40–60% |
Gross margin is the first line of defense for profitability. If it is too thin, no amount of operational efficiency rescues the business.
Net profit margin
Definition: What remains after COGS, operating expenses, interest, and taxes. Formula: Net Profit ÷ Revenue × 100
Net profit margins vary widely across retailers depending on format and volume.
A worked example
A store's gross and net profit margins illustrate how changes in cost of goods sold affect overall profitability. That single data point tells the owner to either renegotiate with the supplier, adjust pricing, or shift the assortment toward higher-margin SKUs.
Practical levers to improve margin:
- Negotiate supplier terms annually, especially for top-volume SKUs.
- Shift promotional spend toward high-margin categories rather than discounting across the board.
- Control shrinkage: Retail shrinkage is a significant factor impacting profitability, costing retailers billions annually.
- Review the assortment quarterly and discontinue SKUs with gross margin below your category floor.
6. How to choose the right KPIs and set targets for your store
Most retail operators find that 8–12 metrics reviewed consistently are more useful than 30 metrics reviewed sporadically. The goal is a focused set that covers all four groups without creating reporting overhead that nobody acts on.
A practical KPI selection checklist
- Align to a business goal. Every KPI should answer a question your leadership team is already asking. If nobody is asking about capture rate, do not track it yet.
- Cover all four groups. A dashboard with only Money metrics will miss efficiency and people problems until they become expensive.
- Assign an owner. Retail KPIs become valuable only when tied to a decision and a person responsible for acting on them.
- Set a review cadence. Operational metrics (traffic, conversion, daily sales) need daily or weekly review; strategic metrics (CLV, same-store growth) belong in monthly or quarterly business reviews.
- Define an action trigger. What does a 5% drop in conversion rate mean you should do? Write it down before the drop happens.
Sample KPI packs by maturity level
| KPI Pack | Metrics Included | Review Cadence |
|---|---|---|
| Entry (1–2 stores) | Gross margin %, ATV, conversion rate, inventory turnover, foot traffic | Weekly |
| Standard (3–10 stores) | Entry pack + sales per sq ft, labor cost %, sell-through rate, same-store sales growth | Weekly + monthly |
| Advanced (10+ stores / omnichannel) | Standard pack + GMROI, CLV, shrinkage rate, capture rate, transactions per labor-hour, return rate | Daily + weekly + monthly |
Setting realistic targets
- Use your own historical baseline as the primary benchmark, especially for a single store. External benchmarks are useful for context but rarely account for your location, demographics, or format.
- Location-adjusted benchmarks matter for multi-store chains: a store in a dense urban market should not be held to the same foot traffic target as a suburban strip-mall location.
- Set targets in ranges, not single points. A conversion rate target of 28–33% is more honest than a single 30% goal and gives managers room to diagnose without triggering false alarms.
7. Why unified data and real-time dashboards make KPIs worth tracking
Tracking metrics in spreadsheets works until it does not. The moment you need to correlate foot traffic with POS data and labor hours across three locations, manual processes break down. The shift from tracking to acting on metrics in near real time is what separates efficient retail chains from reactive ones.
The core requirement is data unification: footfall, POS, inventory, and labor data need to live in one place with synchronized timestamps. Without that, conversion rate calculations can be wrong simply because the people counter and the POS system are on different time zones or update at different intervals.
The operational case for unified data: When a store manager can see foot traffic, conversion, and labor cost % on a single dashboard refreshed every few minutes, they can make a staffing call at 11 AM that affects the lunch rush. When those numbers live in three separate systems, that call happens the following week in a spreadsheet review — if it happens at all.
Platforms that unify POS, payroll, and inventory connectors into a single data warehouse remove the manual reconciliation step entirely. Datalakehouse is built specifically for this use case: a no-code, fully managed integration that pulls sales, labor, and inventory data into one source so retail managers can act on KPIs without waiting for an IT project.
Pro Tip: When setting up a unified dashboard, start with just three synchronized data sources: your POS system, your people counter, and your inventory platform. Get those three clean and consistent before adding payroll or loyalty data. A dashboard built on three reliable sources beats one built on six unreliable ones.
8. Common mistakes and red flags when using retail KPIs
Even well-chosen metrics can mislead if the underlying data or interpretation is flawed.
Common measurement mistakes:
- Over-tracking. A 30-metric dashboard where nobody owns any metric is worse than a 10-metric dashboard with clear accountability. More metrics do not mean better decisions.
- Comparing stores without location adjustment. A downtown flagship and a suburban outlet serve different catchment areas. Raw conversion rate comparisons between them are misleading without adjusting for traffic quality and demographics.
- Mixing period types. Comparing a 4-week December to a 4-week January without flagging the seasonal difference produces false same-store sales conclusions.
- Ignoring seasonality in inventory turnover. A fashion retailer's turnover in Q4 will look very different from Q2. Always compare the same period year-over-year, not quarter-to-quarter.
- Poor data sync between footfall and POS. This is the most technically damaging error. Latency or misaligned timestamps between people-counting hardware and POS systems produce erroneous conversion rates — a problem that accurate POS synchronization is specifically designed to prevent.
Red-flag checklist — when a metric change signals measurement error vs. real business change:
- Conversion rate drops 15% overnight with no change in staffing or merchandising → check footfall counter calibration and POS sync.
- Inventory turnover spikes without a corresponding sales increase → check for a data entry error in average inventory calculation.
- Labor cost % drops sharply in a week where sales were flat → verify that all labor hours were captured, including overtime.
- Same-store sales growth turns negative while ATV is rising → foot traffic may be declining; pull traffic data to confirm.
Validate before you act: Before making a staffing cut or a markdown decision based on a single week's data, cross-reference the metric against at least two other related KPIs. A conversion rate drop confirmed by a flat ATV and declining foot traffic is a real signal. A conversion rate drop with stable ATV and stable traffic is almost certainly a data quality issue.
Key Takeaways
Retail performance metrics are only as useful as the decisions they drive — pick a balanced set across Money, Efficiency, People, and Results, assign an owner to each, and review them on a cadence that matches the speed of the decision.
| Point | Details |
|---|---|
| Start with a balanced KPI set | Cover all four groups: Money, Efficiency, People, and Results to avoid blind spots in your diagnosis. |
| Use formulas and benchmarks together | The U.S. national retail average sales per square foot varies depending on category and location. |
| Tiered review cadence matters | Review operational metrics (traffic, conversion) daily or weekly; review strategic metrics (CLV, same-store growth) monthly or quarterly. |
| Validate before acting | Cross-reference any metric change against two related KPIs before making a staffing or markdown decision. |
| Datalakehouse unifies the data | Datalakehouse connects POS, inventory, and labor data into one real-time dashboard so managers can act on KPIs without manual reconciliation. |
Why these metrics matter more than the tools you use to track them
There is a tendency in retail analytics to treat the dashboard as the destination. Operators invest in reporting platforms, spend weeks configuring views, and then review the same metrics they always reviewed — just in a prettier interface. The metrics themselves, and the decisions they are tied to, are what actually move the business.
The examples in this article are not exhaustive. Retail is too varied for a universal KPI list to apply equally to a single-location specialty boutique and a 200-store national chain. What matters is the discipline: pick metrics that answer the questions your business is actually asking, assign ownership, set a cadence, and define what action each metric triggers. A conversion rate target with no assigned owner and no defined response protocol is just a number on a screen.
The retailers who use these KPIs most effectively tend to share one habit: they review metrics in the context of other metrics, not in isolation. Foot traffic plus conversion plus ATV tells a story. Any one of those numbers alone tells you almost nothing actionable.
Datalakehouse makes your KPI data work in real time
Knowing your metrics is one thing. Having them update automatically, across every store, without a manual export or a data wrangling session, is what makes them operationally useful. Datalakehouse is a fully managed, no-code platform that unifies your POS, inventory, payroll, and scheduling data into a single source of truth, giving retail managers real-time dashboards and automated reporting without IT overhead.
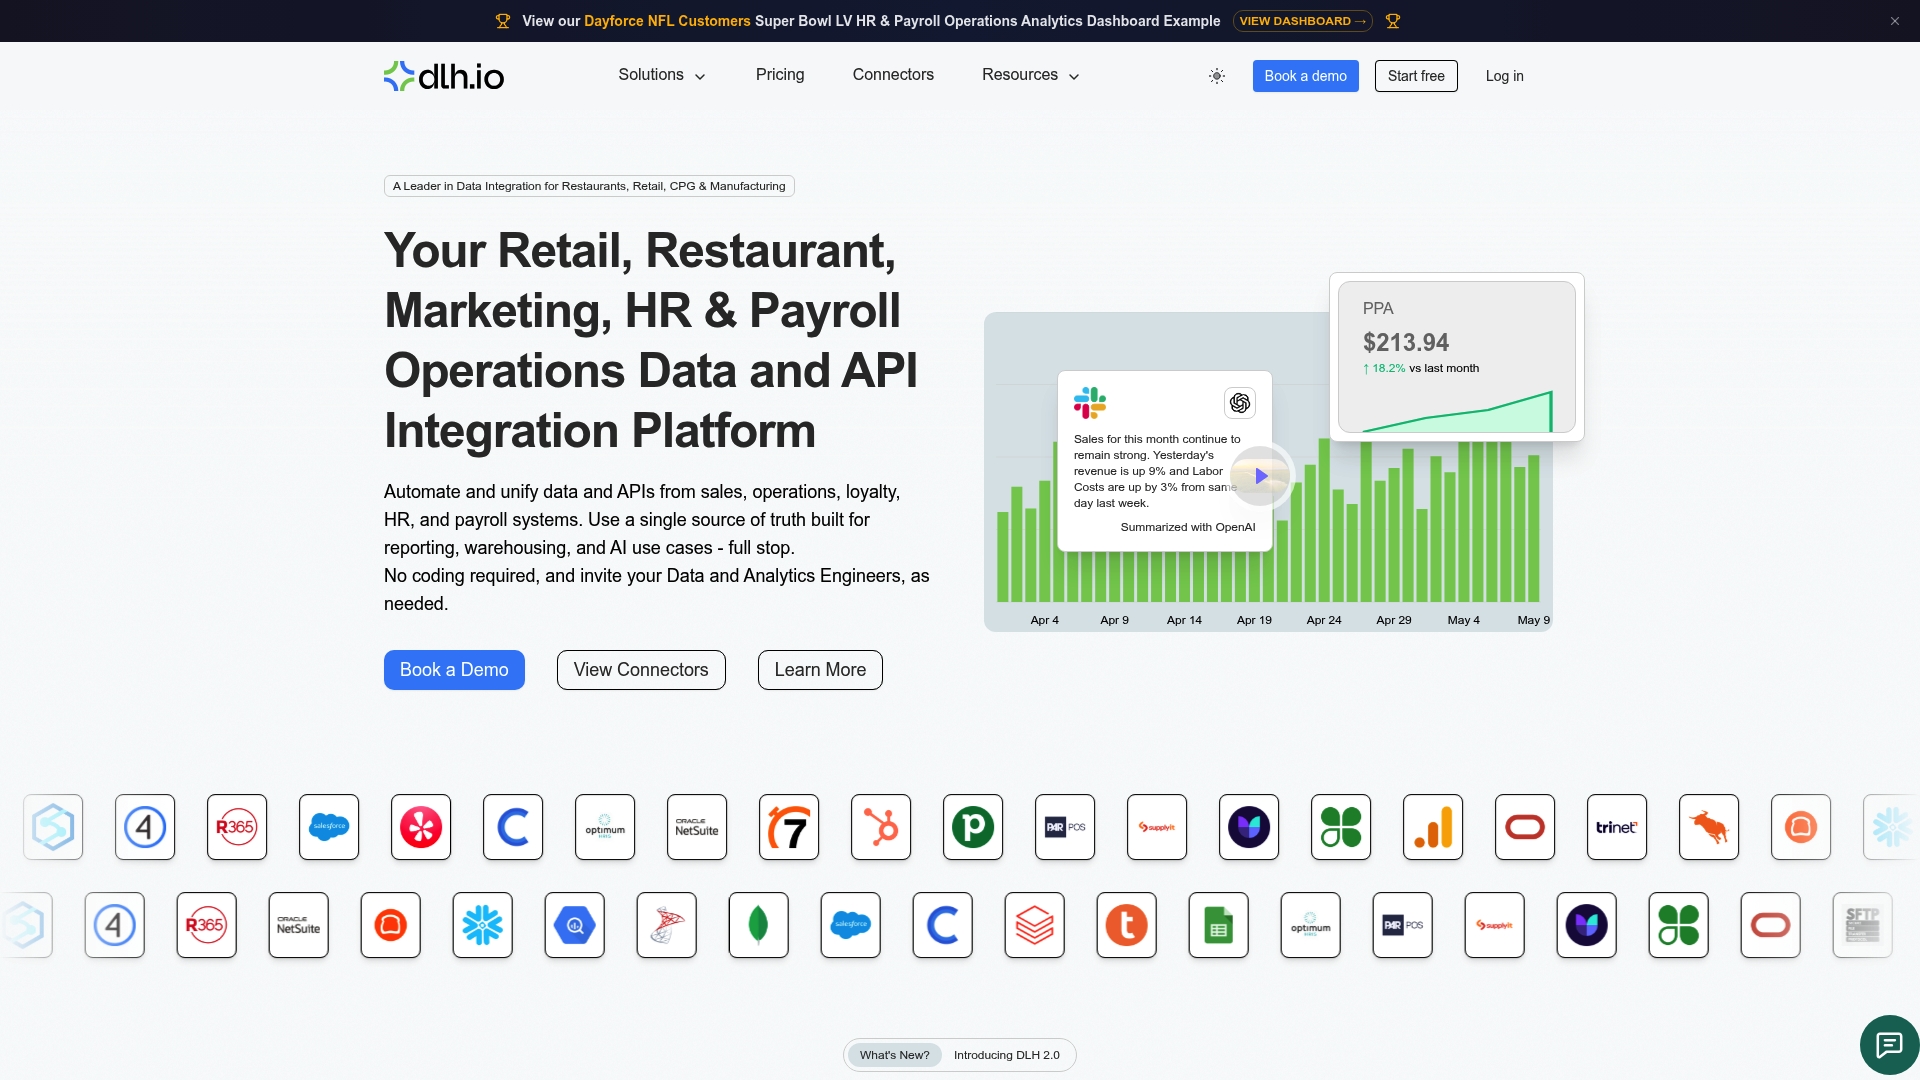
If your team is still reconciling footfall and POS data in spreadsheets, or waiting until month-end to see gross margin by location, the retail solutions at Datalakehouse are built to close that gap. You can explore the full connector catalog, see which POS and inventory systems integrate out of the box, and schedule a demo to see a live dashboard built on your own data.
Useful sources and further reading
- Retail Metrics: 16 Key Metrics for Your Store — Shopify: A practical overview of the most common retail KPIs grouped by category; good starting point for KPI selection.
- Essential Retailer Performance Reports Guide — Shopify Enterprise: Covers the specific reports available in Shopify's POS and analytics suite; useful for technical implementation of sales, inventory, and customer reports.
- Key Performance Indicators for Retail — Hoxton AI Blog: Strong on the data-sync requirements for accurate conversion rate measurement; recommended for teams setting up people-counting hardware.
- 19 Most Important KPIs for Retail Businesses — NetSuite: Covers review cadence and strategic vs. operational KPI distinctions; useful for multi-store operators building tiered dashboards.
- Retail KPI Examples with Benchmarks — Stackrows: Detailed benchmark ranges by retail category for conversion rate, ATV, gross margin, inventory turnover, and shrinkage; the most benchmark-dense source in this list.
- 12 Retail Performance Metrics Every Brand Must Track — Kentrix AI: Good on location-adjusted benchmarking and the shift from tracking to acting; relevant for advanced KPI pack design.
- Retail Metrics Guide: KPIs That Improve Inventory Performance — AGR Inventory: Focused on inventory-specific KPIs and their connection to cash flow and replenishment decisions; best for category managers and inventory planners.
- Retail Store Performance Metrics: KPIs and Omnichannel Insights — Proactive AI: Covers KPI ownership, action triggers, and omnichannel measurement; useful for managers building accountability frameworks around their metrics.