
Marketing Analytics: Measure ROI and
Act Faster
Marketing Analytics: Measure ROI and Act Faster
Marketing analytics is the practice of collecting and analyzing performance data across channels, then using descriptive, predictive, and prescriptive models to guide budget and messaging decisions. The payoff is direct: you stop guessing at what drives revenue and start proving it. Marketing analytics as defined by Coursera covers data from paid ads, organic content, email, social, and product interactions, evaluated together rather than in isolated channel reports. Platforms like DLH.io extend this idea by folding operational data into the same picture.
Why this matters for your next budget meeting:
- You can attribute revenue to specific campaigns instead of estimating it
- You can catch underperforming channels before they burn through spend
- You can forecast demand using patterns from past data instead of intuition
Key Takeaways
Marketing analytics succeeds when teams tie every metric to a business outcome and integrate operational data fast enough to act on it before conditions change.
| Point | Details |
|---|---|
| Start with one north-star KPI | Anchor your dashboard to revenue or retention, not raw traffic. |
| Map data sources before buying tools | List every system, including POS and payroll, before choosing software. |
| Match models to questions | Use descriptive for what happened, predictive for what's next, prescriptive for what to do. |
| Fix fragmentation early | Manual reconciliation across systems slows every decision downstream. |
| Consider managed integration | Platforms like DLH.io unify sales, payroll, and inventory data without a dedicated engineering team. |
Table of Contents
- What Marketing Analytics Actually Covers
- Where Marketing Data Comes From and What Breaks It
- Four Models of Analysis, One Measurement Program
- Tools, Platforms, and the Skills That Make Analytics Work
- Choosing KPIs That Actually Reflect Business Health
- A 90-Day Roadmap to Get Started
- How Integrated Data Speeds Up Marketing Analytics in Practice
- Why Operational Data Changes the Marketing Analytics Conversation
- Get Your Marketing and Operations Data Working Together
- Frequently Asked Questions
- Sources
What Marketing Analytics Actually Covers
Marketing analytics spans far more than click-through rates; understanding it deeply is key as described in Analytics for Content Marketing: Boosting SaaS Growth. It includes web analytics, email performance, social engagement, paid media results, CRM records, and increasingly, in-product behavior once a customer converts. That last piece separates real marketing analytics from simple market research or general business intelligence, which tend to describe markets and competitors rather than track individual customer journeys against spend.
The distinction matters because decisions get made at different altitudes. Consider three:
- Budget allocation. You compare cost-per-acquisition across channels and shift spend toward the ones producing profitable customers, not just cheap clicks.
- Message testing. You run A/B tests on subject lines or ad creative, then use the results to decide which version scales.
- Lifetime value optimization. You segment customers by long-term value and adjust acquisition spend to favor the segments that stick around.
Each example depends on data that lives in a different system. That is where most marketing teams hit friction.
Where Marketing Data Comes From and What Breaks It
Your data originates from a scattered set of systems: ad platforms like Google Ads and Meta, web analytics tools, email service providers, social platforms, your CRM, point-of-sale systems, and in-product telemetry if you sell software. For businesses in restaurants, retail, or CPG, commercial intelligence also depends on operational sources, inventory levels, payroll data, and supply chain timing, because a marketing win that empties your stock or overloads your staff isn't actually a win.
The problem is that these systems rarely talk to each other. Adverity's research on marketing data analytics points to data silos and manual ingestion as the core bottleneck; harmonizing formats, timestamps, and customer identifiers by hand is slow and error-prone. Common symptoms include:
- Duplicate customer records across CRM and email platforms
- Mismatched date ranges between ad platform reports and internal sales data
- Currency or unit inconsistencies when comparing regional campaigns
- Attribution windows that vary by tool, making cross-channel comparison unreliable
Pro Tip: Before buying another dashboard tool, audit how many spreadsheets your team exports weekly just to reconcile numbers between systems. That number tells you whether your real problem is analytics or integration.
Four Models of Analysis, One Measurement Program
Marketing analytics generally breaks into four model types, and each answers a different question. Descriptive analytics tells you what happened, like last quarter's conversion rate by channel. Diagnostic analytics tells you why, tracing a conversion drop back to a broken checkout flow or a lapsed ad audience. Predictive analytics forecasts what's likely next, estimating which leads will convert based on behavior patterns. Prescriptive analytics recommends what to do about it, suggesting a specific budget shift or creative refresh.
| Model Type | Question Answered | Marketing Example |
|---|---|---|
| Descriptive | What happened? | Email open rates by campaign, quarter over quarter |
| Diagnostic | Why did it happen? | Tracing a paid-search CPA spike to a bidding change |
| Predictive | What's likely next? | Scoring leads by likelihood to convert |
| Prescriptive | What should we do? | Recommending a reallocation from underperforming social ads to search |
Most teams start with descriptive dashboards, which is fine, but the real value shows up once diagnostic and predictive work get layered on. Coursera's overview of marketing analytics frames this progression as the shift from reactive reporting to genuinely evidence-based decisions.
Tools, Platforms, and the Skills That Make Analytics Work
Marketing analytics runs on a stack, not a single tool. You'll typically need an analytics platform (Google Analytics or similar), a tag manager to control what data gets captured, a customer data platform if you're unifying identities across channels, a BI or visualization layer such as Looker Studio, Tableau, or Power BI, and increasingly, an experimentation platform for structured A/B testing. Salesforce's marketing analytics offering illustrates how enterprise suites now bundle connectors and AI-assisted attribution to shortcut manual mapping work.
The harder question isn't which tool to buy. It's whether to integrate your data yourself or hand that job to a managed platform.
- DIY integration gives you full control but demands ongoing engineering time for every new connector or schema change.
- Managed, no-code integration platforms trade some customization for speed. You get pre-built connectors and normalized data without hiring a data engineering team.
- For lean marketing teams without dedicated technical staff, managed integration usually wins on time-to-insight alone.
On the human side, four skills matter more than any specific software license: basic SQL to query your own data instead of waiting on someone else, experimentation design to run tests that actually isolate cause and effect, dashboarding to turn numbers into something a stakeholder can act on, and storytelling to explain what the data means to people who don't read spreadsheets for fun.
Pro Tip: Hire or train for storytelling before you hire for a fourth visualization tool. A team that can explain "why" in two sentences gets more budget approved than one with the prettiest dashboard.

Choosing KPIs That Actually Reflect Business Health
Pick a north-star metric tied to revenue or retention, not one tied to vanity. A north-star KPI should be something the whole team can rally around, like net new revenue from marketing-sourced pipeline or 90-day customer retention rate.
From there, organize supporting metrics by objective:
- Acquisition: cost per acquisition, qualified session rate, channel-level conversion rate
- Activation: time to first value, onboarding completion rate
- Retention: repeat purchase rate, churn by cohort
- Revenue: margin-adjusted return on ad spend, customer lifetime value by segment
Run a quick audit: if a metric on your dashboard can't be tied to one of those four objectives, it's probably a vanity metric taking up space. Supermetrics' guidance on digital marketing analytics recommends prioritizing cohort-based lifetime value and margin-adjusted ROAS over raw traffic counts, since traffic alone says nothing about profitability.
A 90-Day Roadmap to Get Started
You don't need a year-long transformation plan. You need five steps, executed in order.
- Define goals. Pick one north-star KPI and two or three supporting metrics tied to it.
- Map your data. List every system holding relevant data: ad platforms, CRM, POS, payroll, inventory.
- Choose your tooling. Decide between assembling point solutions yourself or adopting a managed integration platform.
- Build dashboards. Start with descriptive reporting, then layer in diagnostic views once the basics are stable.
- Run experiments. Test one variable at a time, and document results so future decisions build on evidence, not memory.
For your first 90 days: weeks one through two, assign a data owner and complete the source inventory. Weeks three through six, connect your top three data sources and validate that numbers match across systems. Weeks seven through ten, ship your first dashboard to stakeholders and collect feedback. Weeks eleven through thirteen, launch one controlled experiment and report results with a recommendation attached.
Pro Tip: Assign data governance to one named owner from day one, even if it's a part-time responsibility. Ungoverned data pipelines break quietly, and nobody notices until a board deck has the wrong revenue number in it.
How Integrated Data Speeds Up Marketing Analytics in Practice
Restaurant, retail, and CPG operators face a specific version of the fragmentation problem: sales, payroll, and inventory sit in separate systems that were never built to talk to each other. DLH.io's data integration resources describe how a no-code, fully managed platform can unify those systems into one warehouse without requiring a data engineering hire.
Clients using this kind of managed approach report:
- Faster reporting cycles, since data doesn't need manual reconciliation before a dashboard update
- Real-time sales analytics that reflect current performance instead of last week's export
- Labor-cost tracking tied directly to sales volume, catching overstaffing or understaffing early
A managed integration layer doesn't just save engineering hours. It changes what a marketing team can ask of its own data, because the answer no longer depends on whether someone remembered to export the payroll file on time.
A managed platform makes the most sense once manual reconciliation starts eating more hours than the analysis itself.
Why Operational Data Changes the Marketing Analytics Conversation
The conventional advice on marketing analytics stops at the marketing stack: connect your ad platforms, build a dashboard, call it done. That advice undersells the problem. A campaign that drives a sales spike your inventory can't support isn't a win, and a promotion that requires overtime labor to fulfill might be quietly losing money even as it hits its conversion targets.

What gets underestimated is how much commercial intelligence, not just campaign intelligence, drives good marketing decisions. Descriptive and predictive models are table stakes now; the differentiator is whether your predictive model has access to payroll and inventory signals or just click data. Teams that treat marketing analytics as a closed loop isolated from operations end up optimizing for metrics that look good on a slide and mean less on a balance sheet.
If you take one thing from this guide, prioritize data integration before you prioritize dashboard polish. A beautiful chart built on incomplete or delayed data will mislead you faster than no chart at all. Fix the pipeline first. Everything downstream gets easier.
Get Your Marketing and Operations Data Working Together
If fragmented systems are the roadblock standing between your team and faster reporting, DLH gives you a way around it without adding headcount. DLH is a no-code, fully managed data integration platform built for restaurants, retail, CPG, and manufacturing businesses that need sales, payroll, and inventory data unified into one source, not spread across five logins.
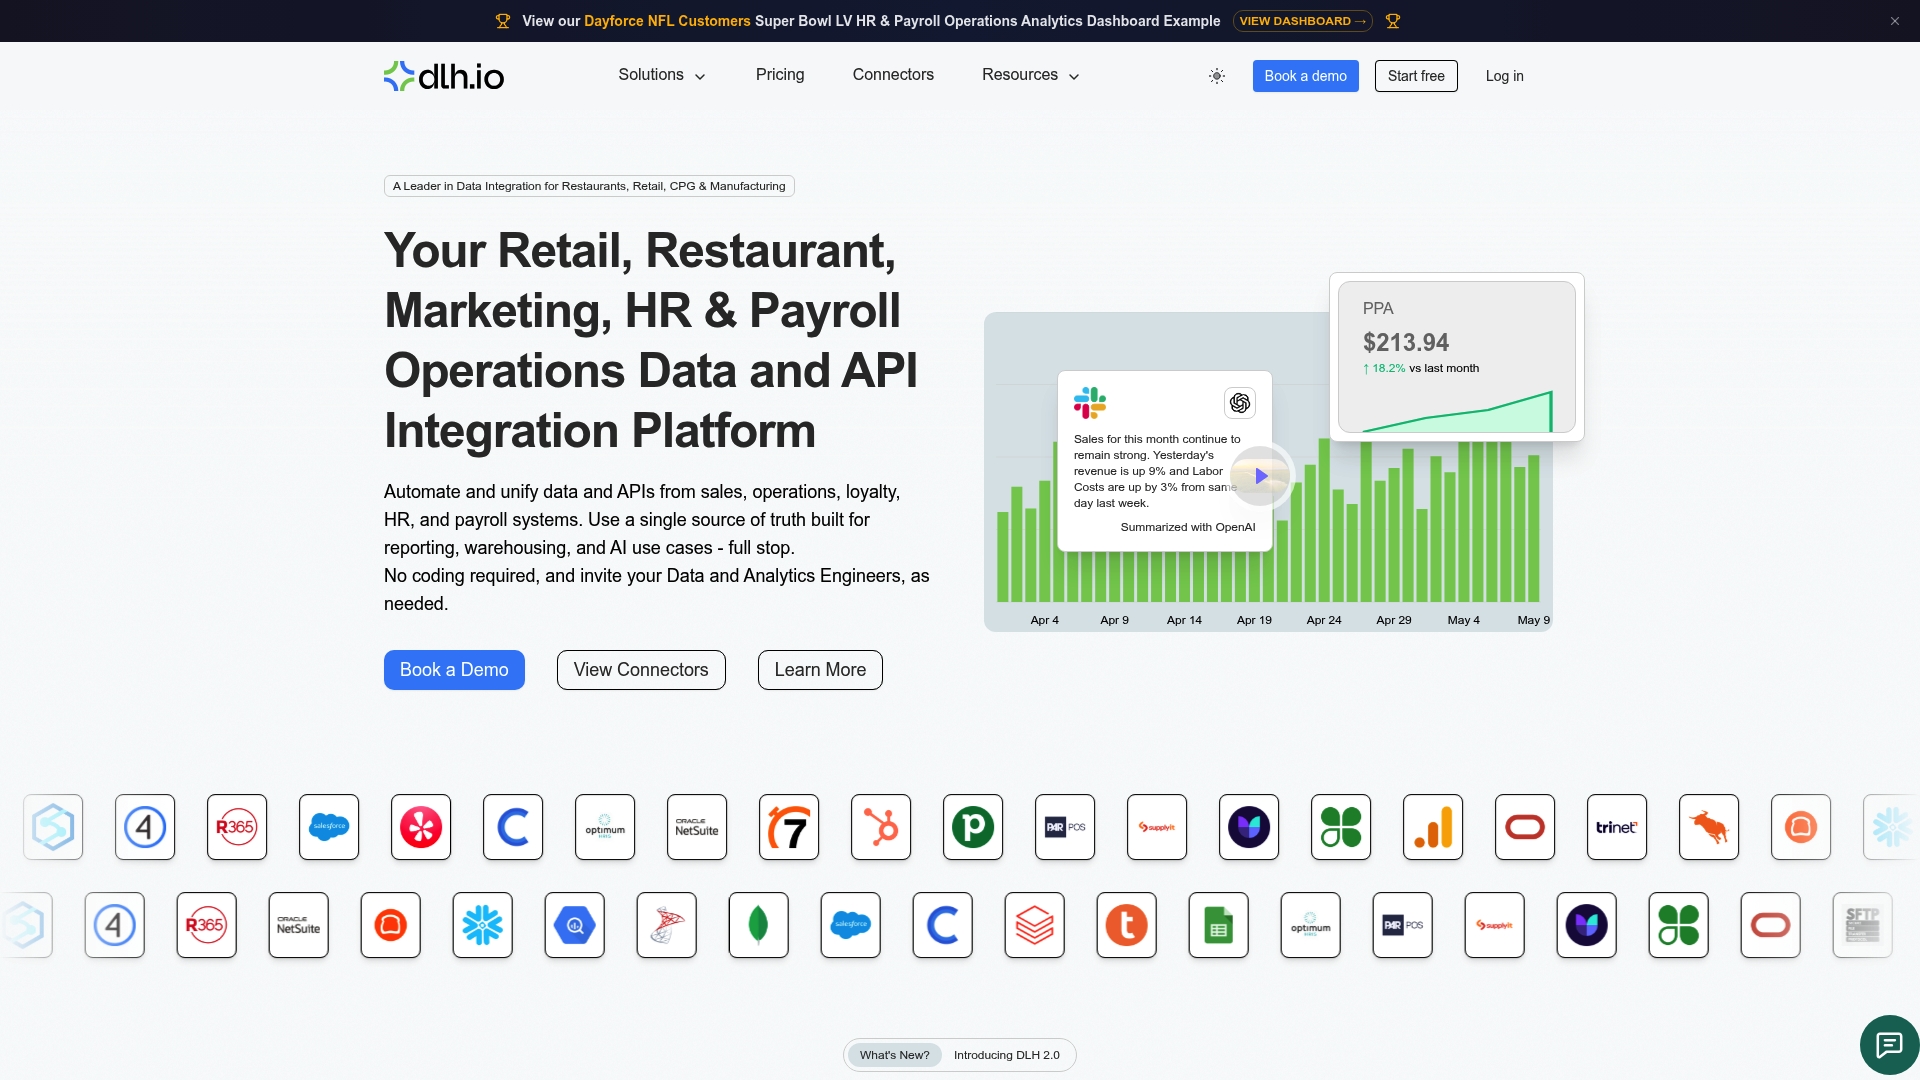
Instead of stitching together point tools or waiting on a data engineer's backlog, you get pre-built connectors and managed pipelines that turn raw operational and marketing data into dashboards you can actually trust. That matters most for teams without dedicated technical resources, since the platform handles the integration work that usually eats the first three months of any analytics project. Explore the connector catalog to see which of your systems can plug in, or visit DLH.io directly to schedule a walkthrough of how unified reporting could look for your business.
Frequently Asked Questions
What is marketing analytics in simple terms?
Marketing analytics is the process of gathering data from your marketing channels, like ads, email, and social, and analyzing it to understand what's working and guide future decisions. It replaces guesswork with evidence.
What's the difference between marketing analytics and market analysis?
Market analysis looks outward at industry trends and competitors. Marketing analytics looks at your own performance data, tracking specific campaigns, customers, and channels against measurable outcomes.
Do I need a data scientist to do marketing analytics?
Not necessarily. Basic SQL knowledge, a solid BI tool, and clear KPI definitions cover most marketing teams' needs. Complex predictive modeling may require deeper expertise, but managed integration platforms reduce the technical lift significantly.
Which metrics should a small marketing team track first?
Start with cost per acquisition, conversion rate by channel, and a basic retention metric like repeat purchase rate. Add margin-adjusted return on ad spend once you have reliable revenue data flowing in.
How does data integration improve marketing analytics results?
Integration eliminates the manual reconciliation that delays reporting and introduces errors. When sales, payroll, and inventory data connect automatically, marketing decisions reflect current operational reality instead of last week's spreadsheet export.
Sources
- Marketing analytics (Coursera article)
- Digital marketing analytics (Supermetrics)
- Digital Marketing Analytics Tools (Salesforce)