
Track Retail Sales by Category
Real-Time: 2026 Guide
Track Retail Sales by Category Real-Time: 2026 Guide

Real-time retail sales category tracking is the instant consolidation and visualization of sales data segmented by product categories across all stores and channels. Retail managers who track retail sales by category real-time gain the ability to act on live revenue shifts, stock shortages, and margin changes before they compound into larger problems. This guide walks you through the systems you need, the steps to build effective dashboards, the KPIs worth watching, and the pitfalls that trip up most teams. The result is a practical framework for turning live data into faster, smarter decisions.
How to track retail sales by category real-time: what it requires
Real-time category sales monitoring depends on connecting the right data sources into a single, unified platform. Without that foundation, your dashboards show stale numbers and your decisions lag behind reality.
The three core systems you must integrate are your point-of-sale (POS) system, your inventory management platform, and your e-commerce data feed. Real-time analytics platforms consolidate POS, inventory, and e-commerce data into a single view, enabling near-instant visibility by category and store. That single view eliminates the manual reconciliation that slows most retail teams down.

A governed semantic layer sits at the center of any reliable setup. A single governed semantic layer is a critical success factor because it ensures consistent KPI definitions across all retail departments, preventing data trust issues and confusion. Without it, your merchandising team's definition of "net sales" will differ from finance's, and your dashboards will produce conflicting numbers that no one trusts.
AI-powered analytics tools add another layer of speed. Some dashboards deploy within 5–10 minutes and continuously update as POS data streams in. That speed matters when a category starts underperforming mid-afternoon and you need to act before the day ends.
| Data source | What it provides | Why it matters |
|---|---|---|
| POS system | Transaction-level sales by SKU and category | Core revenue data updated per transaction |
| Inventory platform | Stock levels, reorder points, sell-through rates | Connects sales velocity to replenishment needs |
| E-commerce feed | Online orders by category and channel | Gives a complete omnichannel category picture |
| ERP or finance system | Margin, cost of goods, and promotional data | Adds profitability context to revenue figures |
Key data integration requirements:
- A no-code or low-code connector layer that pulls from POS, inventory, and e-commerce without custom engineering
- A unified data pipeline that refreshes in seconds, not hours
- Role-based access so store managers see their location's data and category analysts see the full portfolio
- A semantic layer that standardizes KPI definitions before data reaches any dashboard
How do you set up a real-time category sales dashboard?
Setting up a live category sales dashboard follows a clear sequence. Skipping steps creates gaps that surface as missing data or misleading visualizations later.
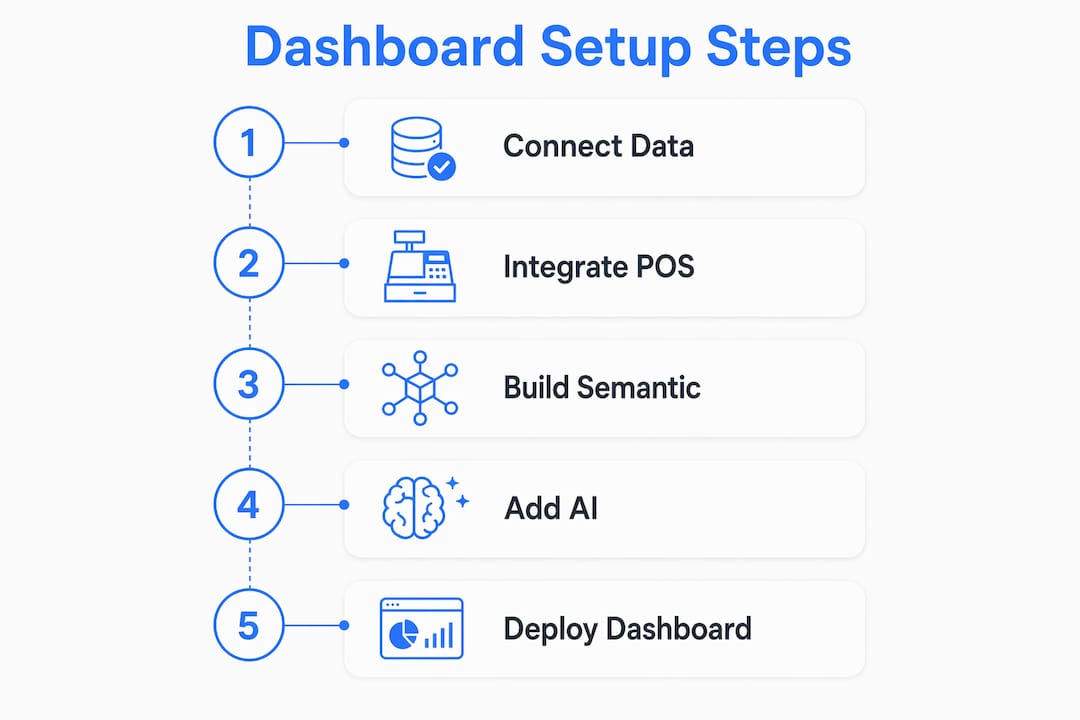
Implementation workflow:
- Audit your data sources. List every system that holds sales, inventory, or customer data. Confirm each system has an API or connector available.
- Connect sources to a central platform. Use POS and data connectors to pipe raw transaction data into a unified data store. Confirm the refresh rate is measured in seconds, not minutes.
- Define your category taxonomy. Agree on a standard category hierarchy before building any visualization. Changing it later breaks historical comparisons.
- Build your semantic layer. Map every KPI to a single agreed definition. Revenue, margin, and sell-through rate must mean the same thing to every team.
- Configure dashboard visualizations. Start with a top-level category revenue view. Add drill-down layers by store, hour, and SKU so managers can move from summary to detail in two clicks.
- Set automated threshold alerts. Automated threshold monitoring alerts managers to KPIs such as revenue drops over 20%, low stock, and high return rates, prompting immediate corrective action.
- Test with live data. Run the dashboard in parallel with your existing reports for one week. Confirm numbers match before decommissioning old reports.
Pro Tip: Limit your top-level dashboard to five or fewer category tiles. Managers who see 20 categories at once stop reading the dashboard within a week. Build depth through drill-downs, not width on the main screen.
Drill-down capability is what separates a useful dashboard from a decorative one. A manager should be able to click "Apparel" and immediately see revenue by subcategory, then by store, then by hour. That path from summary to root cause takes under 30 seconds when the data model is built correctly.
Pro Tip: Color-code your category tiles using a simple traffic-light system: green for on-target, amber for within 10% of threshold, red for breached. Managers process color faster than numbers, especially during peak trading hours.
What KPIs should managers monitor by category in real time?
The right KPIs tell you not just what happened, but what to do next. Monitoring the wrong metrics wastes attention and slows response times.
Generative analytics automates interpreting raw data, shifting managers from data-wrangling to strategic decision making. AI-driven platforms identify specific categories and hours causing sales variances, so you spend time acting rather than calculating.
Essential KPIs for real-time category monitoring:
- Revenue by category: Total sales dollars per category updated per transaction. Watch for intraday dips against the same hour last week.
- Sell-through rate: Units sold divided by units available, expressed as a percentage. A rate below 60% in a fast-moving category signals a pricing or placement problem.
- Gross margin by category: Revenue minus cost of goods sold, per category. Margin erosion often appears here before it shows up in weekly P&L reports.
- Conversion rate by category: For e-commerce channels, the percentage of category page views that result in a purchase. A drop here points to a content or pricing issue, not a demand problem.
- Inventory alert status: Stock levels measured against reorder thresholds. A category going out of stock during peak hours costs revenue that cannot be recovered.
- Return rate by category: Units returned as a percentage of units sold. A spike in returns often signals a product quality issue or a misleading product description.
Monitoring these KPIs simultaneously gives you a complete picture of category health. A category can show strong revenue while margin erodes and returns climb. Watching only revenue misses that signal entirely.
What are the most common pitfalls in real-time category tracking?
The biggest mistake retail teams make is confusing faster reporting with genuine real-time monitoring. True real-time means data updates within seconds of transactions, differentiating it from near-real-time batch exports that still cause latency. Scheduled batch exports delay insights and produce reactive management instead of proactive decisions.
"Reporting requires manual data pulls; monitoring is passive and persistent, enabling timely responses. Fast reporting is insufficient. Retailers need truly live monitoring dashboards to trigger immediate decisions and proactive management."
Dashboard clutter is the second most common failure. Exception-based reporting keeps dashboards useful by focusing attention only on flagged anomalies or KPIs outside normal ranges. Overly cluttered dashboards reduce the value of real-time data because managers stop trusting them.
Common pitfalls and how to fix them:
- Batch exports labeled as real-time. Verify your platform's actual refresh rate. Ask your vendor to show you the timestamp on the last data update during a live demo.
- No semantic layer. If different teams pull different numbers for the same KPI, the root cause is almost always a missing or inconsistent semantic layer. Fix the data model before fixing the dashboard.
- Too many KPIs on one screen. Apply exception-based reporting. Show only KPIs that have breached a threshold. Everything else stays in a secondary view.
- Category taxonomy drift. When product teams rename or restructure categories without updating the data model, historical comparisons break. Assign one owner to the category taxonomy and require a change process.
- Alerts with no assigned owner. An automated alert that goes to a shared inbox gets ignored. Assign each alert type to a specific role with a defined response time.
Pro Tip: Review your dashboard's alert log weekly. If more than 30% of alerts go unacknowledged, the threshold is set too low. Raise it until only genuinely critical events trigger a notification.
Key Takeaways
Real-time category sales monitoring works only when live data integration, a governed semantic layer, and exception-based alerting operate together as a system.
| Point | Details |
|---|---|
| Integration is the foundation | Connect POS, inventory, and e-commerce into one platform before building any dashboard. |
| Semantic layer prevents confusion | Standardize KPI definitions across all departments to maintain trust in your data. |
| True real-time means seconds | Batch exports cause latency; confirm your platform updates within seconds of each transaction. |
| Exception-based alerts drive action | Show only breached KPIs on your main dashboard to keep manager attention focused. |
| AI reduces analytical workload | AI-driven platforms identify which categories and hours caused variances, so managers act instead of calculate. |
Why most retail teams are solving the wrong problem
Real-time data is not the goal. The goal is faster, better decisions. I've seen retail teams invest months building live dashboards only to find that managers still open a spreadsheet every morning. The dashboard was technically real-time. The workflow was not.
The shift that actually changes behavior is moving from reporting to monitoring. Reporting asks managers to seek out information. Monitoring delivers the right signal at the right moment. That distinction sounds simple, but it requires a completely different approach to how you configure alerts, assign ownership, and train your team to respond.
AI-driven generative analytics is accelerating this shift. When a platform can tell a manager "your women's footwear category dropped 18% in the last two hours, driven by store 14 and store 22," the manager does not need to analyze. They need to call the store. That is the version of real-time analytics worth building toward.
The adoption barrier is rarely technical. Teams that fail to get value from real-time dashboards almost always have a governance problem, not a technology problem. No one agreed on what "sell-through rate" means. No one owns the alert response process. The data is live, but the organization is not. Fix the process first, then the technology will deliver its full value.
— Christian
Real-time retail analytics with Datalakehouse
Datalakehouse is built for retail teams that need live category visibility without a data engineering team behind them. The platform connects your POS, inventory, and e-commerce streams into a single governed data source, then surfaces live retail dashboards that update per transaction.
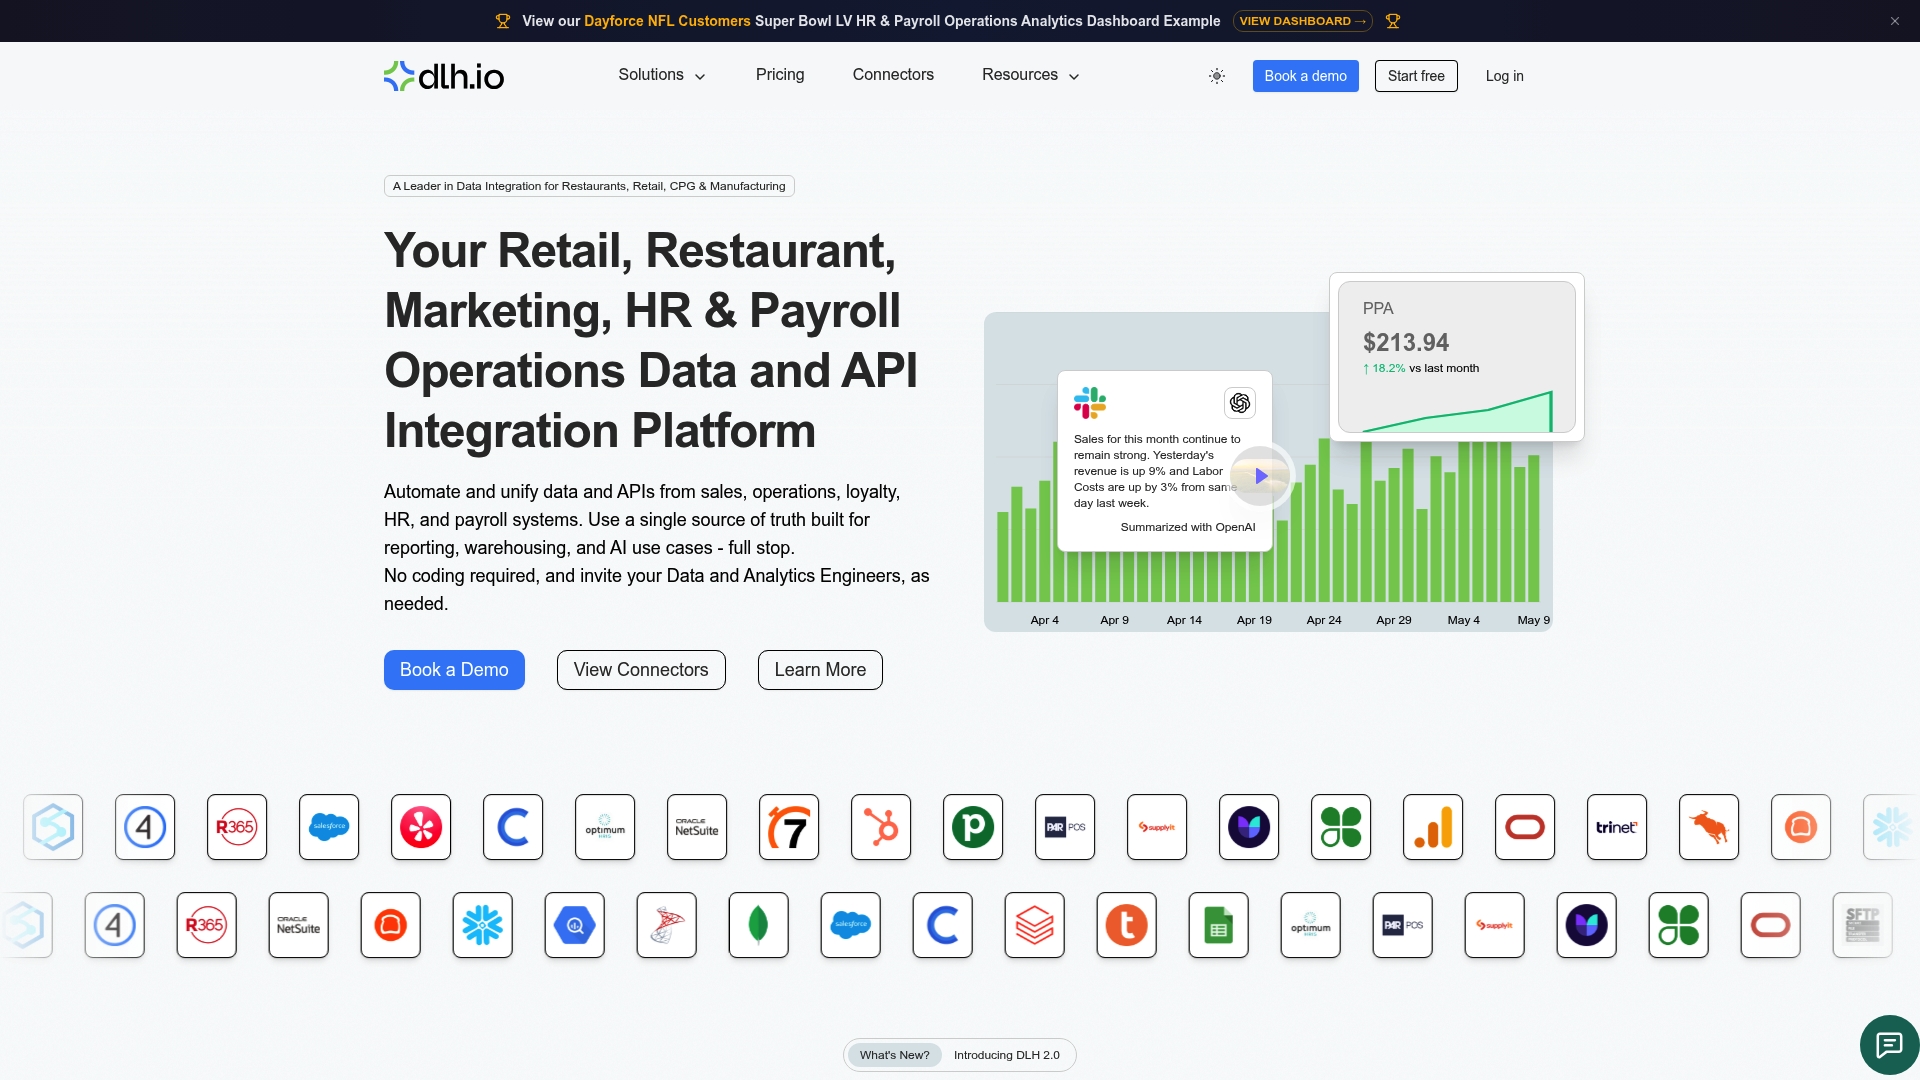
AI-powered natural language querying lets managers ask "which categories are below target this hour?" and get an immediate answer, no SQL required. Anomaly detection flags margin dips and stock alerts automatically, so your team responds to exceptions rather than hunting for them. Datalakehouse deploys without custom coding, which means you get from data connection to live category dashboard in days, not months. Explore the retail analytics solutions and see how your category data can work harder for your team.
FAQ
What does real-time retail sales tracking actually mean?
Real-time retail sales tracking means your dashboard updates within seconds of each transaction, not on a scheduled batch cycle. Any delay longer than a few seconds is near-real-time, not true real-time.
How do I track sales by product category across multiple stores?
Connect all store POS systems to a unified data platform with a consistent category taxonomy. A governed semantic layer ensures each store's data maps to the same category definitions before it reaches your dashboard.
What is the most important KPI for category sales monitoring?
Gross margin by category is the most critical KPI because it shows whether a category is profitable, not just popular. High revenue with eroding margin signals a pricing or cost problem that revenue alone will not reveal.
Why do real-time dashboards fail to change manager behavior?
Dashboards fail when they show too much data without clear alerts. Exception-based reporting solves this by surfacing only KPIs that have breached a threshold, reducing cognitive load and driving faster responses.
How quickly can a real-time category dashboard be deployed?
AI-powered retail analytics platforms can deploy and begin updating dashboards within 5–10 minutes of connecting a POS data stream, depending on the complexity of the category taxonomy and the number of integrated systems.